🚀 Boost Laravel Performance with New Relic: Full Integration & Pro Tips
Laravel is beloved for its expressive syntax and developer-friendly ecosystem. But once your app hits production, performance issues, slow queries, or silent errors can hurt the user experience—and your bottom line.
That’s where New Relic steps in. It’s not just an APM (Application Performance Monitoring) tool—it’s a full observability platform that gives you live insight into your Laravel app’s behavior, performance bottlenecks, and critical issues before they escalate.
Let’s walk through how to integrate New Relic with Laravel and how to unlock its most powerful features.
🧩 Why Pair Laravel with New Relic?
Laravel gives you rapid development. New Relic gives you production visibility. Together, they help you scale confidently and debug proactively. Here's what you get:
✅ Transaction Performance Monitoring
Measure route and controller execution time. Identify slow endpoints and deep-dive into middleware, view rendering, or DB queries causing the lag.
✅ Error Tracking & Alerts
Automatically capture and log exceptions. Set up alerts for spikes in 5xx responses, specific error types, or sudden exception surges.
✅ Log Ingestion & Correlation
Forward Laravel logs to New Relic Logs. From any error or trace, jump directly to the related log line—perfect for debugging.
✅ Database Query Visibility
See which SQL queries are slow, repeated (N+1), or poorly indexed. Segment performance by endpoint or controller to fix where it counts.
✅ External Service Monitoring
Track outbound HTTP requests (to APIs, webhooks, etc.), their latency, and error rates—great for pinpointing issues in external dependencies.
✅ Infrastructure Metrics
Running on Docker, VMs, or Kubernetes? Monitor CPU, memory, disk, and network usage with automatic alerts on resource saturation.
✅ Deployment Tracking
Tag every deployment and track app performance before and after.
➡️ Check out this guide on how to mark Laravel deployments in New Relic.
✅ Custom Dashboards & Alerts
Build dashboards tailored to your stack—track custom KPIs, business events, or performance trends.
➡️ Need alert ideas? Start with throughput and error rate anomalies. I cover this in detail in this article.
✅ Job Queue Monitoring
Track Laravel queue jobs: see execution time, failure rate, and throughput. Find out when workers get overloaded.
✅ Redis & Cache Monitoring
Monitor hit/miss ratio and latency for Redis or Memcached. Crucial for performance-critical apps relying on cache.
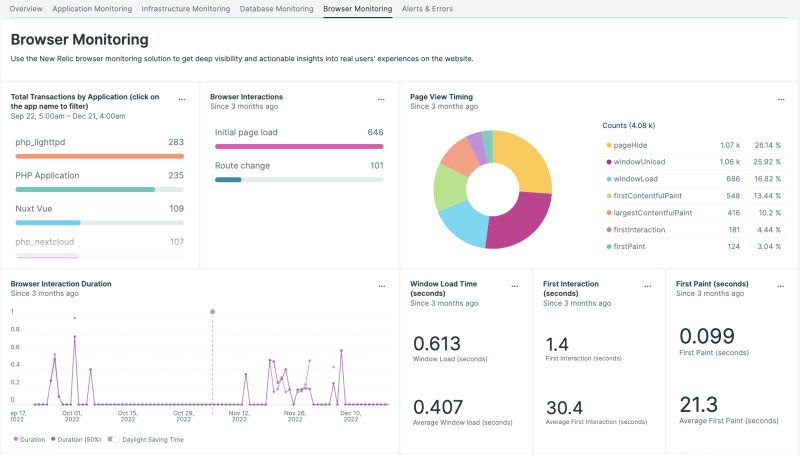
✅ Real User Monitoring (RUM)
Measure frontend performance with New Relic Browser—track TTFB, page load, JS execution, and correlate with backend traces.
✅ Synthetic Monitoring
Simulate user flows like logins or checkouts from global locations. Get alerted when critical paths break or slow down.
⚙️ How to Integrate New Relic with Laravel
Getting started is straightforward. Here’s how:
- Install the New Relic PHP Agent
Follow New Relic’s official installation guide for your OS or Docker environment. - Configure the Agent
In yournewrelic . inior PHP config:
newrelic.appname = "YourLaravelApp"
newrelic.license = "YOUR_LICENSE_KEY" - Enable Laravel Instrumentation (Optional but Recommended)
Use a community package likeinvisnik/laravel-newrelic, or write a service provider to name transactions and report custom events:
\NewRelic::nameTransaction('CheckoutController@index'); - Verify Everything Works
Trigger traffic to your Laravel app. In a few minutes, you should start seeing data in your New Relic dashboard.
🧠 Best Practices for New Relic + Laravel
- Name Transactions Clearly
Avoid generic names likeGET /api/data. Name by controller/action or business logic to make traces meaningful. - Send Custom Events
Report things likeUserRegistered,PaymentFailed, orQueueDepthto get business-level visibility. - Use It With Other Tools
New Relic plays well alongside Laravel Telescope, Sentry, or self-hosted log platforms for full-stack observability.
🎯 Final Thoughts
New Relic turns your Laravel app into a transparent, observable system. With just a few configuration steps, you get real-time performance insights, error visibility, and proactive alerts—all in one place.
Whether you're scaling a SaaS, maintaining a side project, or managing infrastructure, New Relic is a powerful ally in keeping your app fast and reliable.


Comments ()